How to Create an Annual Report That Truly Engages Your Audience
Annual reports are more than a compliance requirement; they’re a key opportunity to connect with your audience. For nonprofits, they offer a chance to celebrate achievements, increase donor trust, and share the vision for the future. However, the process can feel daunting. What should you include? How do you make it visually engaging?
This guide will help your organization create an annual report that informs, inspires, and stands out. We’ll explore the essential content, storytelling tips, format comparisons, and even the exact tools you need to simplify the annual report development process.
What to Include in Your Annual Report
To make the greatest impact, your report needs to balance transparency with engagement. Here are some must-have sections to include.
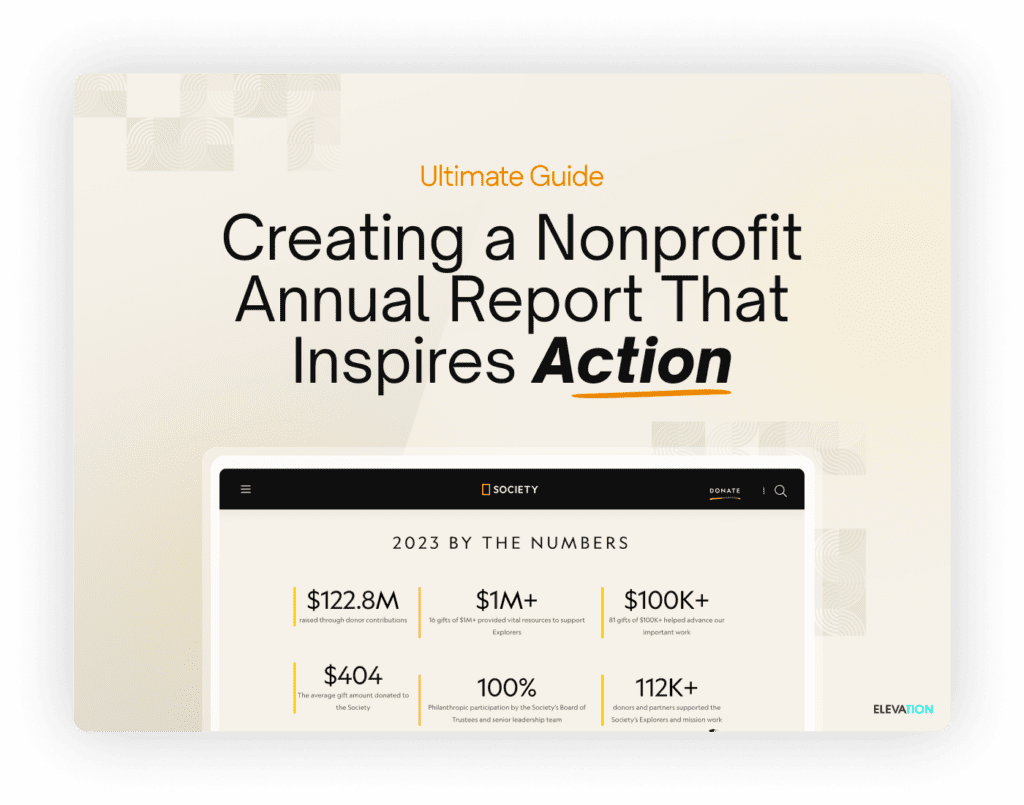
1. Key Metrics
Donors want to see the results of their contributions. Highlight meaningful data on how much money was raised, how funds were allocated, and how many people were impacted. Use key performance indicators (KPIs) to demonstrate progress toward goals. Examples of KPIs include funds raised for specific campaigns, volunteer hours logged, or number of beneficiaries.
2. Impact Stories
Human-centered stories are one of the most effective ways to emotionally engage your audience. Share experiences from beneficiaries, volunteers, or staff. A well-told story can convey your impact more powerfully than pages of statistics. For example: “Alex, a single mother, overcame homelessness with the help of our housing program. Today, she holds a steady job, and her children are thriving in school.”
3. Financials
Transparency builds trust. Include a clear financial overview, such as income, expenses, and where donor funds were allocated. A pie chart or simplified infographic works well for this section.
4. Vision for the Future
Briefly outline what’s next for your organization. Share upcoming campaigns, strategic goals, or exciting projects you hope to launch. Inviting donors to be part of your future creates a sense of shared purpose.
Visual Storytelling Tips
Strong visuals can transform your annual report from a dense document into an engaging experience.
1. Use High-Quality Images
Images of your work in action resonate deeply with readers. Include photos of programs, events, or people impacted by your mission. Candid shots often feel more authentic than posed group photos.
2. Create Infographics for Clarity
Infographics are a great way to simplify complex information. Use bar charts, icons, or timelines to present data in a way that’s accessible and visually appealing.
3. Design With Consistent Branding
Carry your nonprofit’s branding through your annual report. Use your organization’s logo, brand colors, and font styles to create consistency and build recognition.
4. Break Up Text With Callout Boxes
Use callout boxes to draw attention to standout statistics or inspirational quotes. For example, highlight quotes like, “Your support helped us feed 50,000 families this year.”
Comparing Annual Report Formats
Choosing the right format for your annual report depends on your audience and goals. Here’s a quick look at the pros and cons of popular formats.
1. Traditional PDF
A PDF is a widely used file format that preserves document layout across devices and platforms.
- Pros: Easy to create, download, and print.
- Cons: Static, less engaging, and inconvenient to view on mobile devices.
2. Web-Based Microsites
A microsite is a small, standalone website designed to focus on a specific topic or campaign.
- Pros: Interactive, mobile-friendly, and perfect for storytelling. Allows for dynamic features like clickable visuals and video integration.
- Cons: Requires web design skills or a platform like WordPress.
3. Interactive PDFs
An interactive PDF enhances traditional PDFs with features like clickable navigation and animations.
- Pros: Adds clickable navigation and animations to traditional PDFs. Great when transitioning to digital formats without building a microsite.
- Cons: Slightly more complex to design than standard PDFs.
Choosing a web-based microsite or interactive PDF can elevate the storytelling potential of your annual report, but a traditional PDF may suffice for smaller organizations or those with limited technical skills.
Tools to Make Annual Report Design Easier
Creating an eye-catching annual report doesn’t have to mean hours of tedious work. Here are some tools to streamline the process.
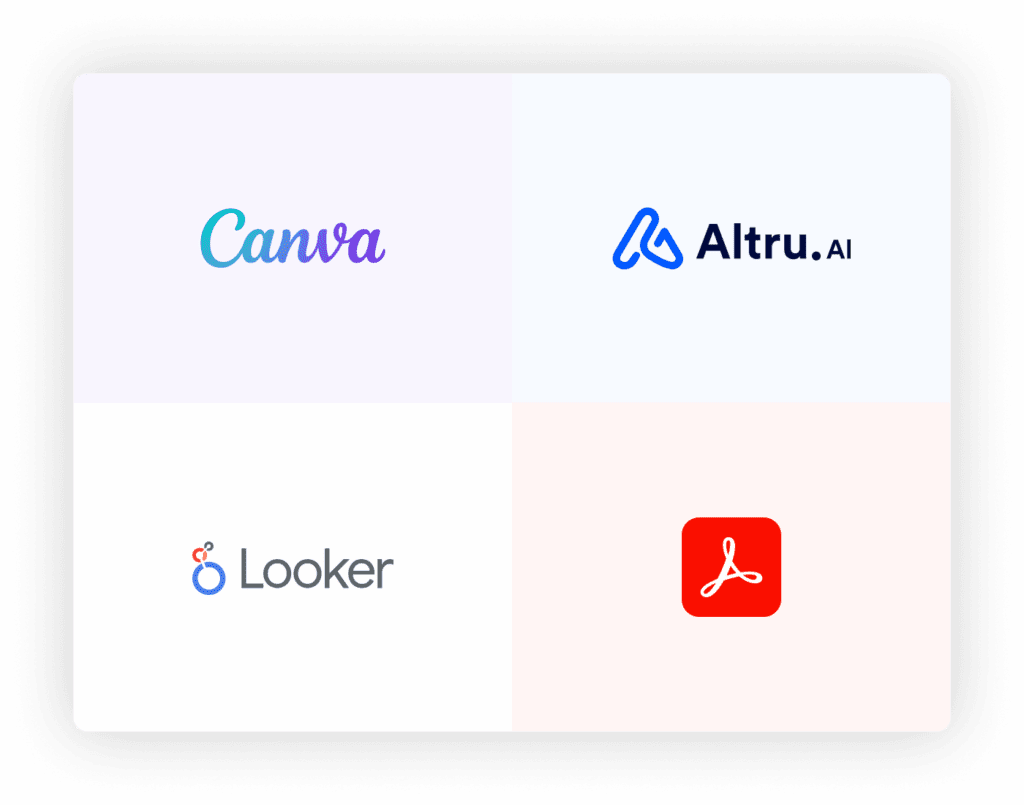
1. Canva
An intuitive, drag-and-drop graphic design tool, Canva offers templates for annual reports, making it easy to design professional, branded reports without design experience.
2. Looker Studio
Looker Studio, formerly known as Google Data Studio, simplifies the process of visualizing complex financial data. It’s an ideal solution for organizations needing to clearly present financial management insights to stakeholders. With ease, you can create polished charts, graphs, and dashboards that integrate seamlessly into digital reports.
3. Altru AI
Looking to build a dynamic microsite for your nonprofit’s annual report? Altru AI, an annual report creation software for nonprofits, simplifies the process by offering AI-powered tools to create interactive pages that bring your report to life.
4. Adobe Acrobat Pro
For nonprofits working with PDFs, Adobe Acrobat allows users to create PDFs with interactive elements like navigation buttons, embedded links, and animations.
Best Practices for Annual Report Distribution
Creating a great report is just one piece of the puzzle. Getting it into the hands of your audience is equally important.
1. Email Campaigns
Send your annual report directly to donors, volunteers, and stakeholders via email. Personalize the email body to thank them for their support and share why this report matters.
2. Website Integration
Create a landing page for your annual report on your website. Include key highlights and teasers, such as statistics or quotes, to encourage visitors to explore the full report.
3. Social Media
Share graphical snippets or short highlights on social media platforms like Instagram, Facebook, and LinkedIn. Use these bite-sized posts to build curiosity and link back to the full report.
4. Physical Copies for Events
For in-person events or high-profile stakeholders, consider printing a few physical copies of your annual report. A professionally bound report can leave a lasting impression.
Make Your Annual Report Shine
An annual report should be more than a document. Rather, it should be an experience that informs, inspires, and excites your audience about your nonprofit’s work. By focusing on storytelling, leveraging visuals, and choosing the right format, you can create a report that leaves a lasting impression.
If you’re ready to reimagine your annual report, there are many resources that you can seek out. Digital tools and full-service digital agencies simplify the process and take your report to the next level.